EDR, ETW and Rust
2026-02-21
Still on the EDR theme. I would like to talk a little bit about Event Tracing for Windows (ETW). ETW is a logging mechanism built into Windows that allows applications and the kernel to log events. From an EDR perspective, it's one of the main sources of telemetry for monitoring system activity.
The API is organized around three components: controllers manage tracing sessions and enable providers, providers generate the events, and consumers read and process them. For EDR purposes, we are interested in the consumer side, specifically consuming events in real time from memory, as opposed to reading from log files.
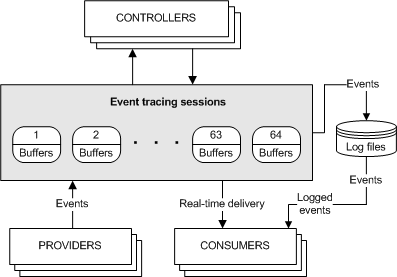
As a consumer, our role is simple: we select one or more ETW sessions as event sources and process the events as they arrive. A consumer can tap into multiple sessions simultaneously, with the system delivering events in chronological order.
ETW is lossy. Events can and will be dropped under certain conditions:
- When an event (including its header and payload) exceeds 64K in size
- When the ETW buffer size is smaller than the event size
- When a real-time consumer isn't consuming events fast enough—if we can't keep up, events get dropped
- When logging to disk, if the disk is too slow to handle the logging rate
ETW is not exactly friendly. There are many details and caveats to navigate just to get a trace session running, and once you do, you still have to deal with schema discovery and parsing event properties. So of course, we shouldn't write all by hand. In Rust, we can use ferrisetw for that.
From the documentation, we have the following example:
use ferrisetw::EventRecord;
use ferrisetw::schema_locator::SchemaLocator;
use ferrisetw::parser::Parser;
use ferrisetw::provider::Provider;
use ferrisetw::trace::{UserTrace, TraceTrait};

fn process_callback(record: &EventRecord, schema_locator: &SchemaLocator) {
    // Basic event scrutinizing can be done directly from the `EventRecord`
    if record.event_id() == 2 {
        // More advanced info can be retrieved from the event schema
        // (the SchemaLocator caches the schema for a given kind of event, so this call is cheap in case you've already encountered the same event kind previously)
        match schema_locator.event_schema(record) {
            Err(err) => println!("Error {:?}", err),
            Ok(schema) => {
                println!("Received an event from provider {}", schema.provider_name());

                // Finally, properties for a given event can be retrieved using a Parser
                let parser = Parser::create(record, &schema);

                // You'll need type inference to tell ferrisetw what type you want to parse into
                // In actual code, be sure to correctly handle Err values!
                let process_id: u32 = parser.try_parse("ProcessID").unwrap();
                let image_name: String = parser.try_parse("ImageName").unwrap();
                println!("PID: {} ImageName: {}", process_id, image_name);
            }
        }
    }
}

fn main() {
    // First we build a Provider
    let process_provider = Provider
        ::by_guid("22fb2cd6-0e7b-422b-a0c7-2fad1fd0e716") // Microsoft-Windows-Kernel-Process
        .add_callback(process_callback)
        // .add_callback(process_callback) // it is possible to add multiple callbacks for a given provider
        // .add_filter(event_filters)      // it is possible to filter by event ID, process ID, etc.
        .build();

    // We start a real-time trace session for the previously registered provider
    // Callbacks will be run in a separate thread.
    let mut trace = UserTrace::new()
        .named(String::from("MyTrace"))
        .enable(process_provider)
        // .enable(other_provider) // It is possible to enable multiple providers on the same trace.
        // .set_etl_dump_file(...) // It is possible to dump the events that the callbacks are processing into a file
        .start_and_process()       // This call will spawn the thread for you.
                                   // See the doc for alternative ways of processing the trace,
                                   // with more or less flexibility regarding this spawned thread.
        .unwrap();

    std::thread::sleep(std::time::Duration::from_secs(3));

    // We stop the trace
    trace.stop();
}
Nice, prety simple, right? And with that we can get the finromation we want. But the sad part is what we can do if we are dropping messages? And how do we even know that?
We can query the stats:
logman query "YourSessionName" -ets


Name:                 YourSessionName
...
Lost events:          42
Buffers written:      100
Buffers lost:         0
With FerrisEtw we can use TraceProperties to try to optimize the buffers for our usage. Another option is to use a channel to push all the events to another thread.
Also VERY IMPORTANT, do not block on the callback, events are proccessed in order, so if you block, you are holding the queue.